

We share knowledge and bring ideas to life.
Graduates

Publications

Datavisualization.ch
Publication on Data Visualization
We report on the latest research findings and applied use cases of this field. We combined reviews of work done by academics and practitioners with insights from our own work. Although the publication is no longer active, the archive is full of inspirational and educational examples.
Visit Datavisualization.ch
Substratum
Interview Series on Creativity
We feel the pulse of the creative community working at the intersection of art, design, and science. In a series of interviews, we find out what they feel and think about their worlds to get to know their beliefs, motivations and limitations.
Visit Substratumseries.comCommunities

Data Visualization Zürich
Zürich-based meetup group to bring together the diverse community of people involved or interested in data visualization.
Join us on Meetup
Hacks / Hackers Zürich
Zürich chapter of the global network of journalists and technologists to advance digital journalism.
Join us on Meetup
Open Data Association
Swiss chapter of the Open Knowledge Foundation with the aim to make governmental data accessible to everyone.
Join us on Opendata.chExperiments
Maritime Chokepoints
Visualizing the threats facing the world's most critical maritime passages.
View online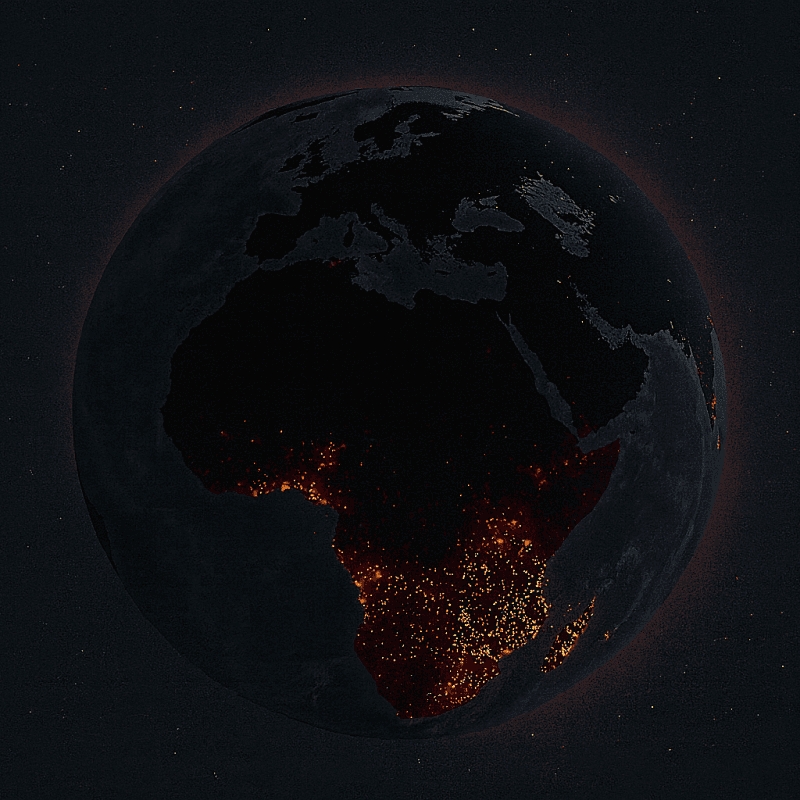
What's That Smell?
Tracking global wildfires using satellite and emissions data.
View online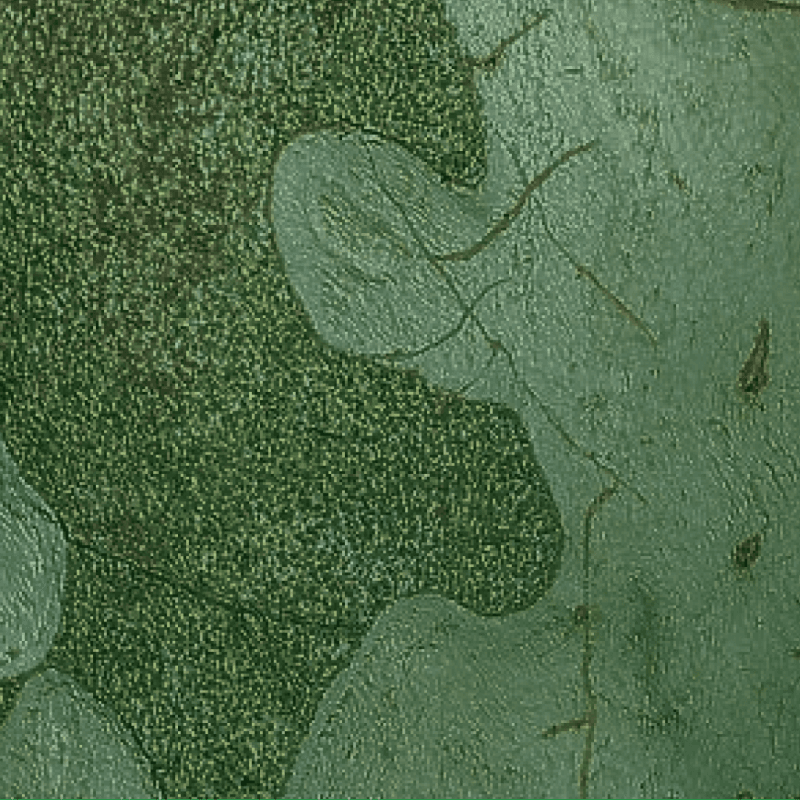
Tree Stories
Comparing Zurich's twelve districts through the lens of their trees.
View online
Beneath the Surface
Exploring prehistoric lake dwellings hidden beneath the Alps through data.
View online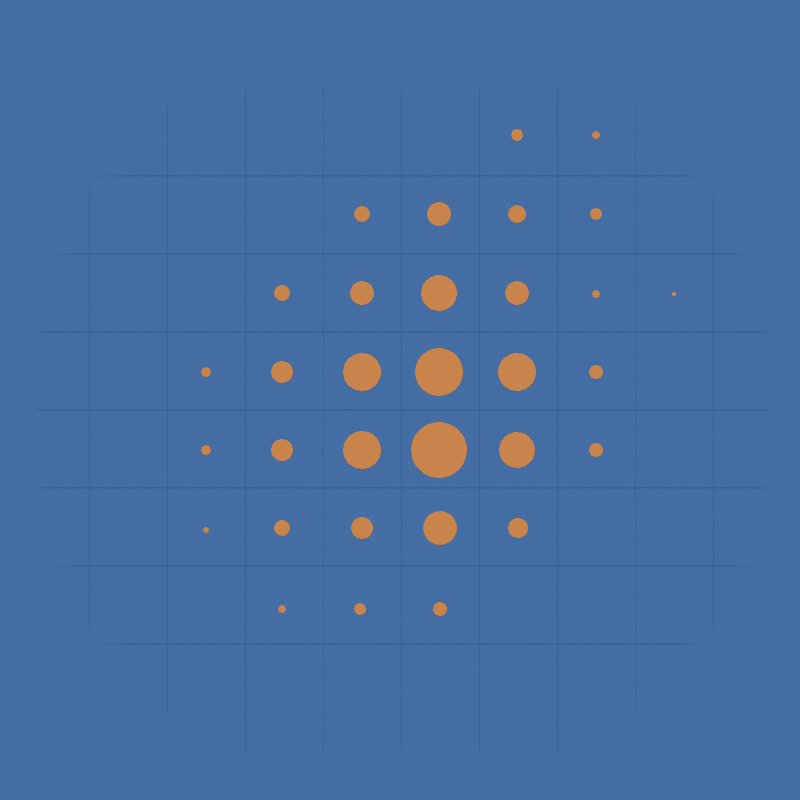
Swiss Museums
Exploring Switzerland's rich and diverse museum landscape.
View online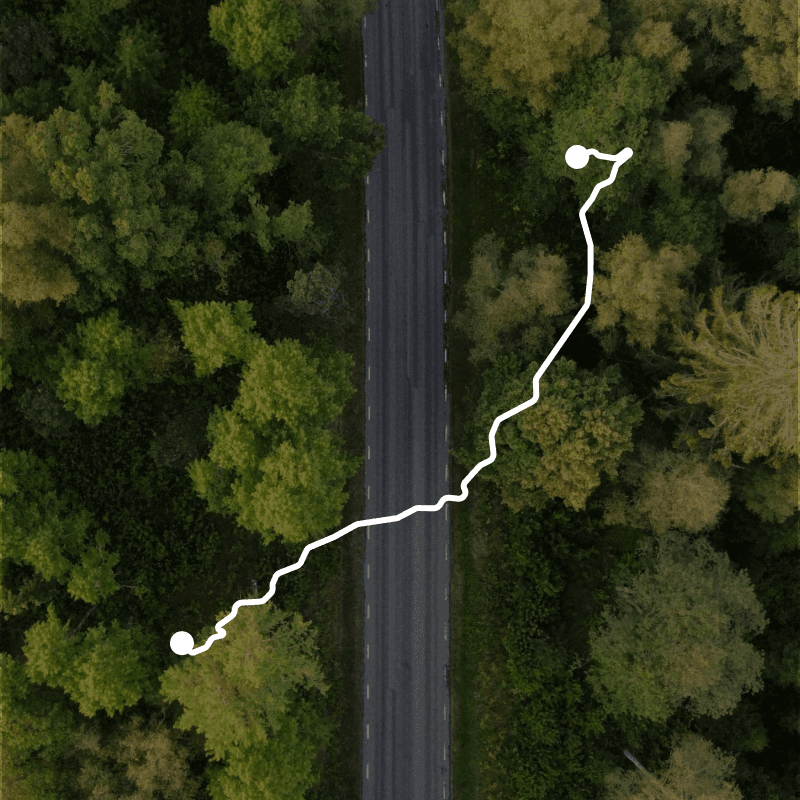
Pathways
Mapping a summer road trip across Sweden and Norway.
View online
Schauspielhaus
Analyzing the historic repertoire of the Schauspielhaus Zürich.
View online
Green Karma
Reducing our waste by promoting restaurants that accept reusable lunch containers.
View online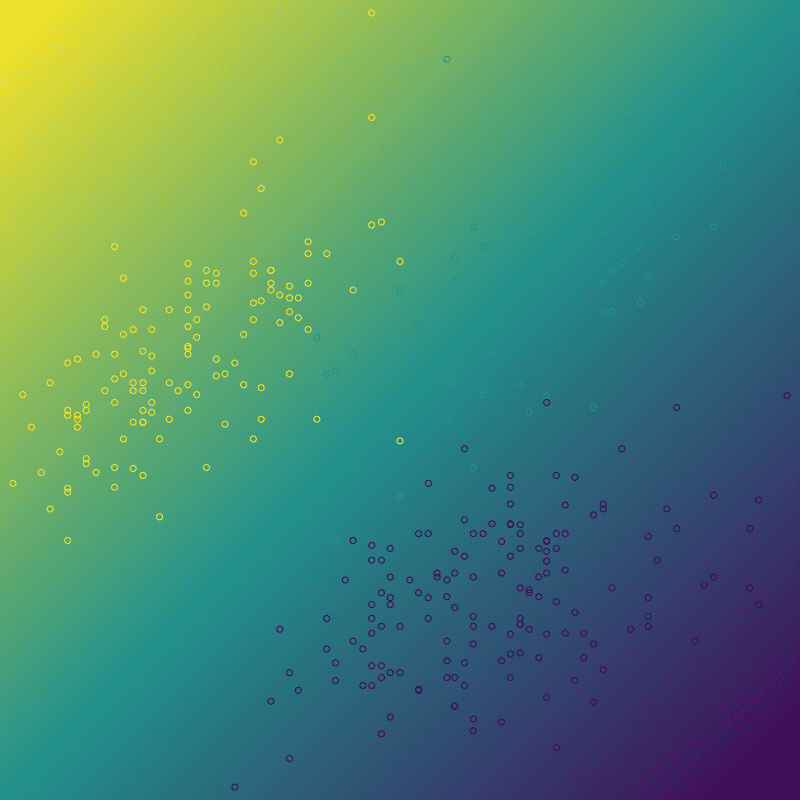
O11ai
Inclusive human data interaction powered by AI.
View online
Swiss Maps Generator
A free tool to generate TopoJSON or SVG from Swisstopo geodata.
View online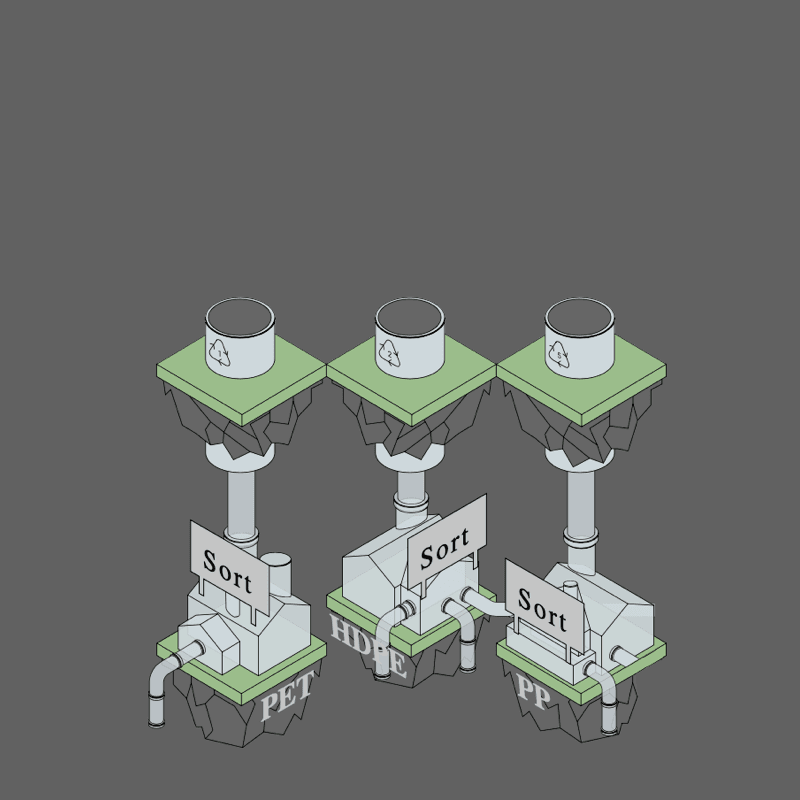
Life of Plastic
Exploring the complex relationship of plastic and its recycling system.
View online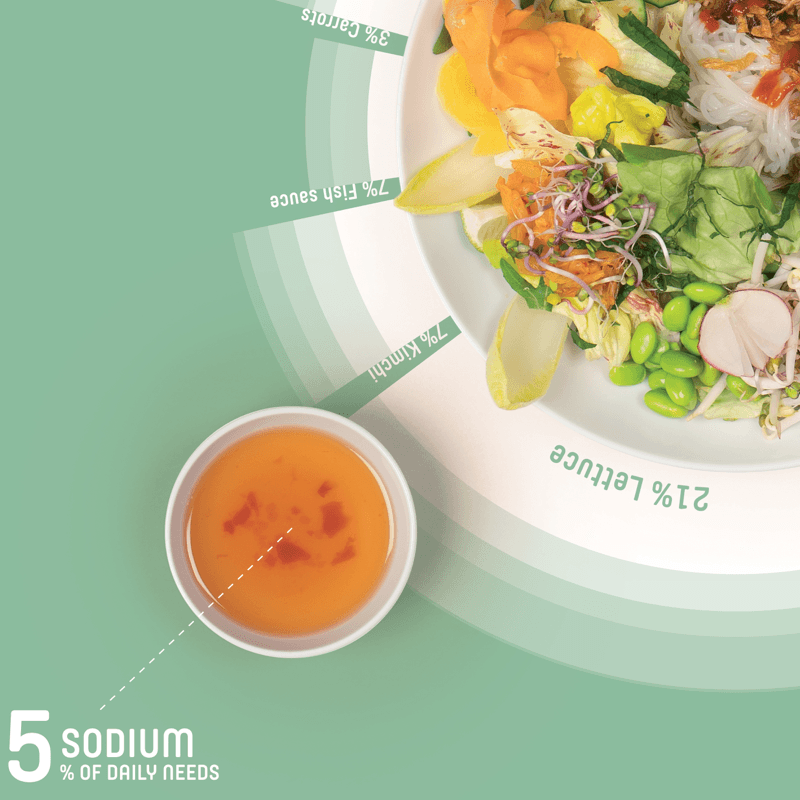
Coming Soon
Visualizing ingredients in Vietnamese cuisine.
View online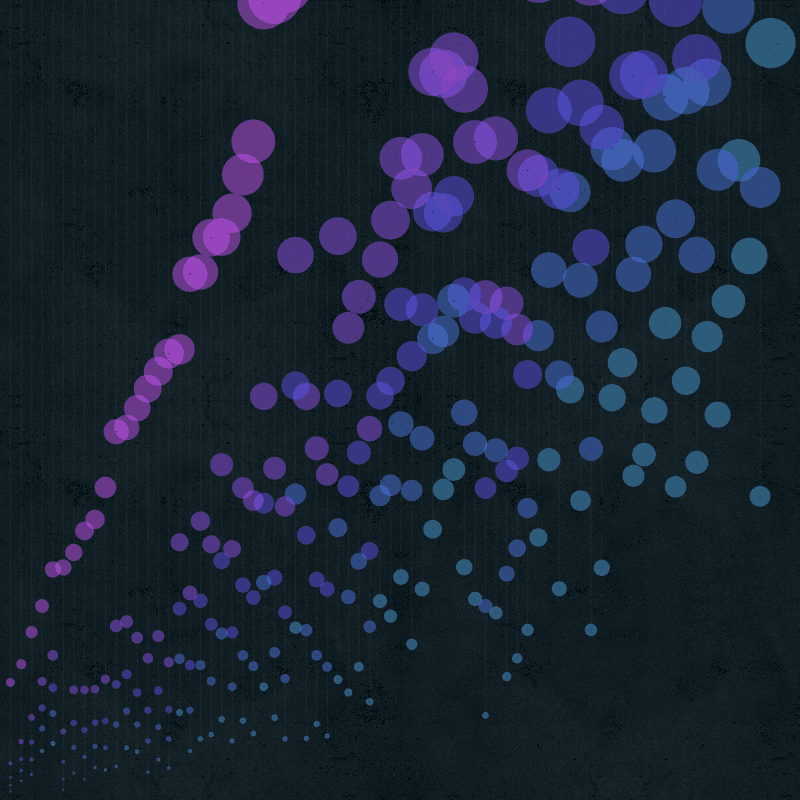
Out of Reach
Visualizing income inequality within and between countries.
View online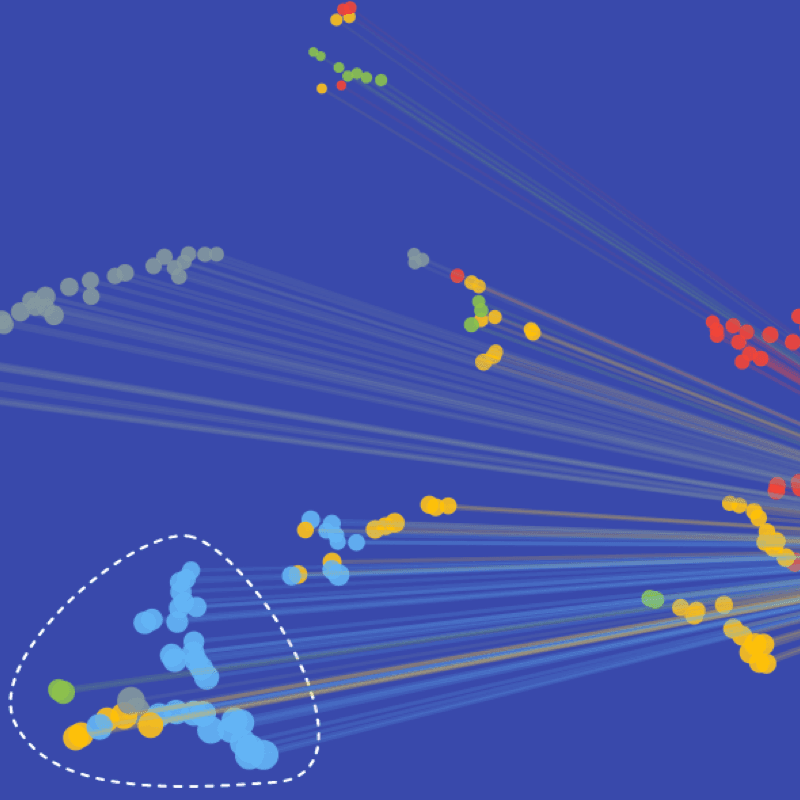
Circle of Nations
An exploration of diplomatic networks and how they reshape the World.
View online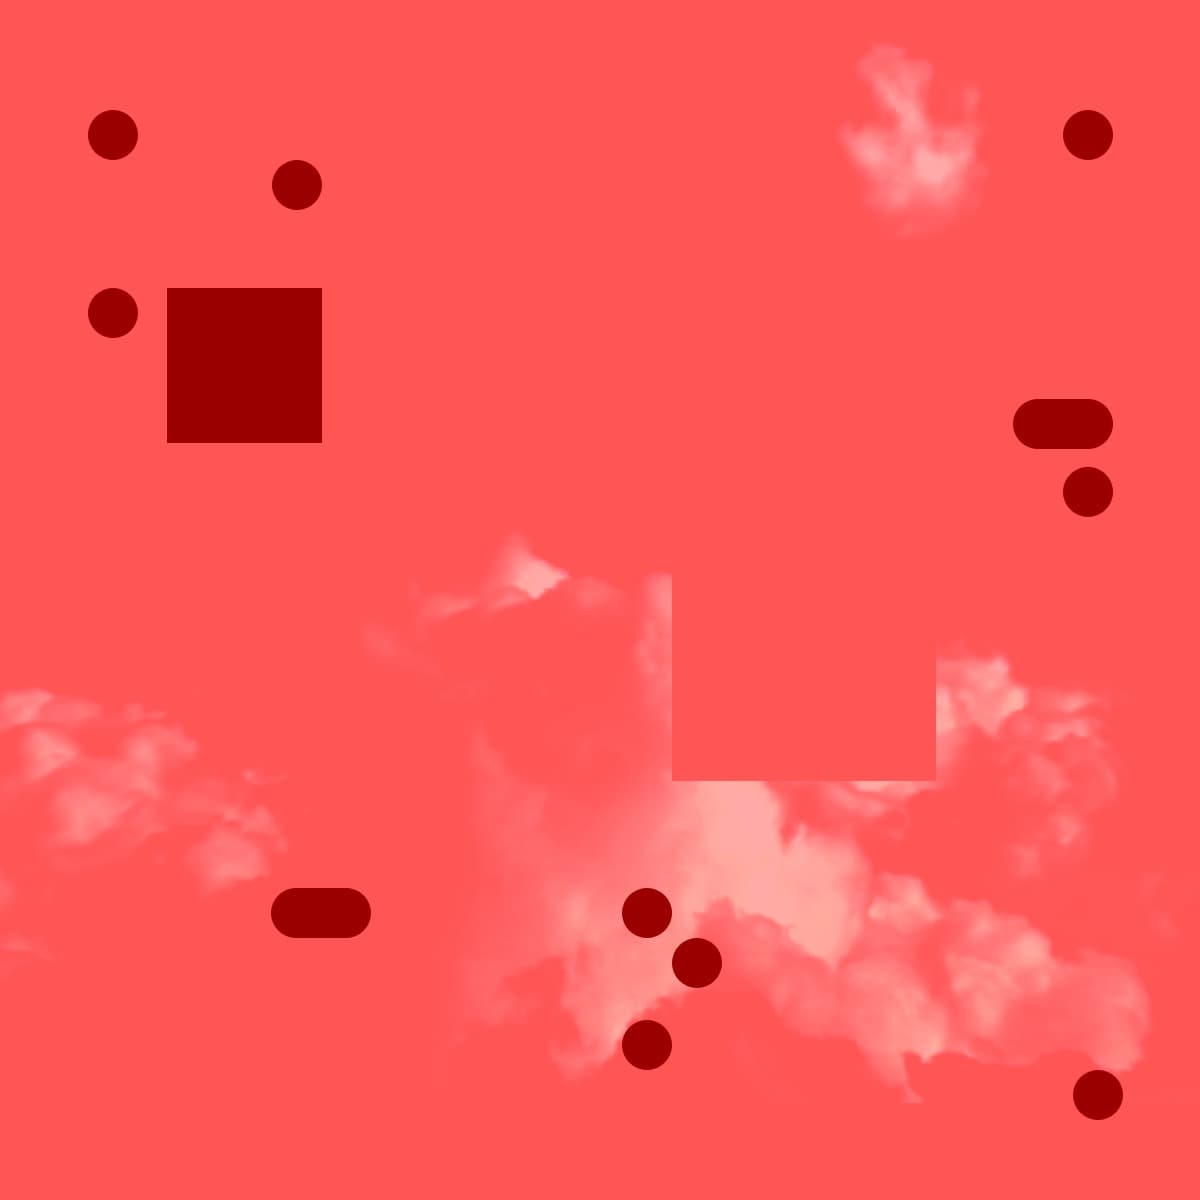
From Crimson to Salmon
An exploration of the correlation between air pollution and the sky’s color at sunset.
View online
Looking for the Earth Next Door
How far are we to living on an exoplanet?
View online
Exploited Hopes and Dreams
There are 21 million victims of modern slavery on any given day. Discover the stories of two victims in Switzerland.
View online
Grand Slam Serve Speed
Serves speed from the top-ranking ATP players in Grand Slam tournaments.
View online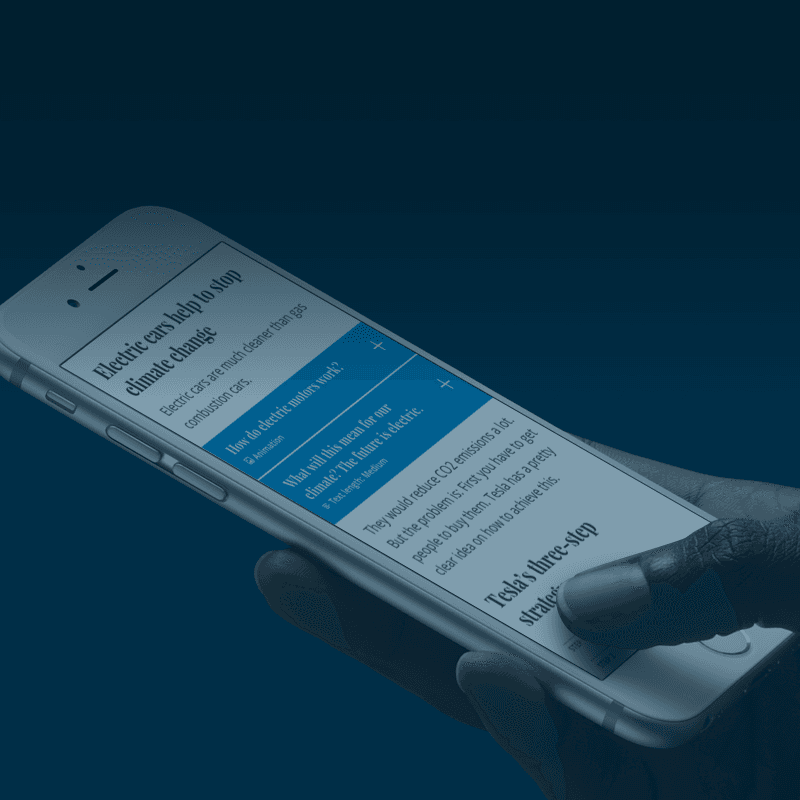
Multicle
A new format for online articles that adapts to the reader’s preferences.
View online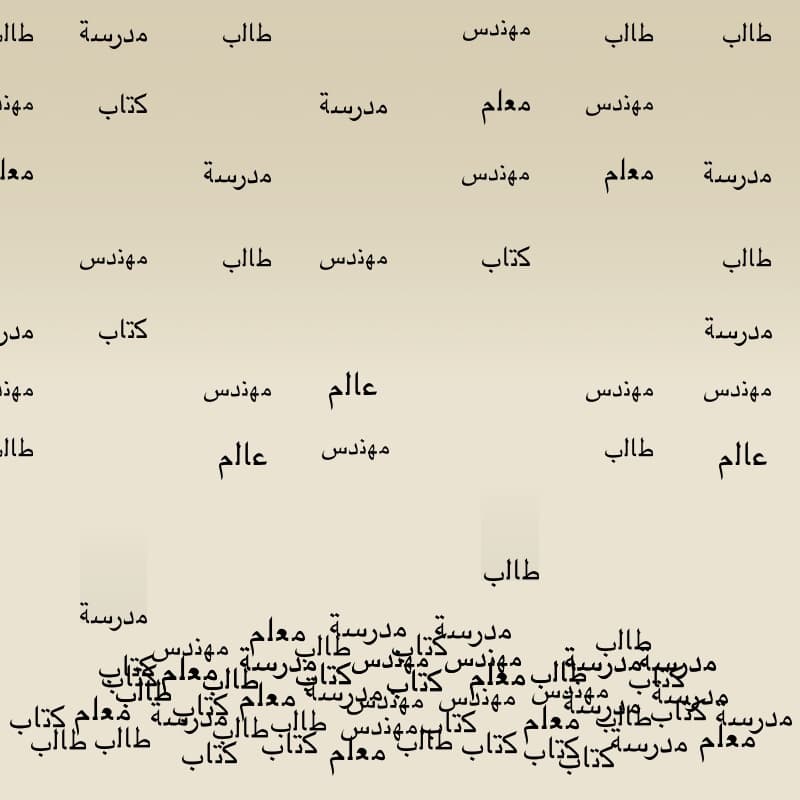
The Road to School
The Syria crisis is robbing millions of children of their right to education.
View online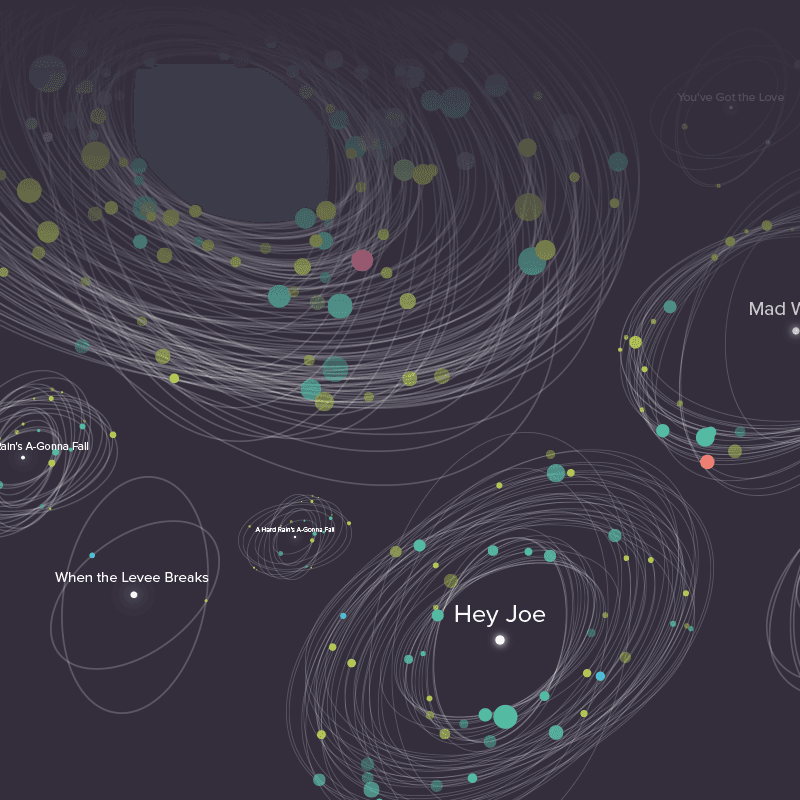
Galaxy of Covers
Honoring the evolution of the 50 most popular cover songs of all time.
View online
The Unified Hour
Interactive exhibition about the UCI One Hour Record.
View online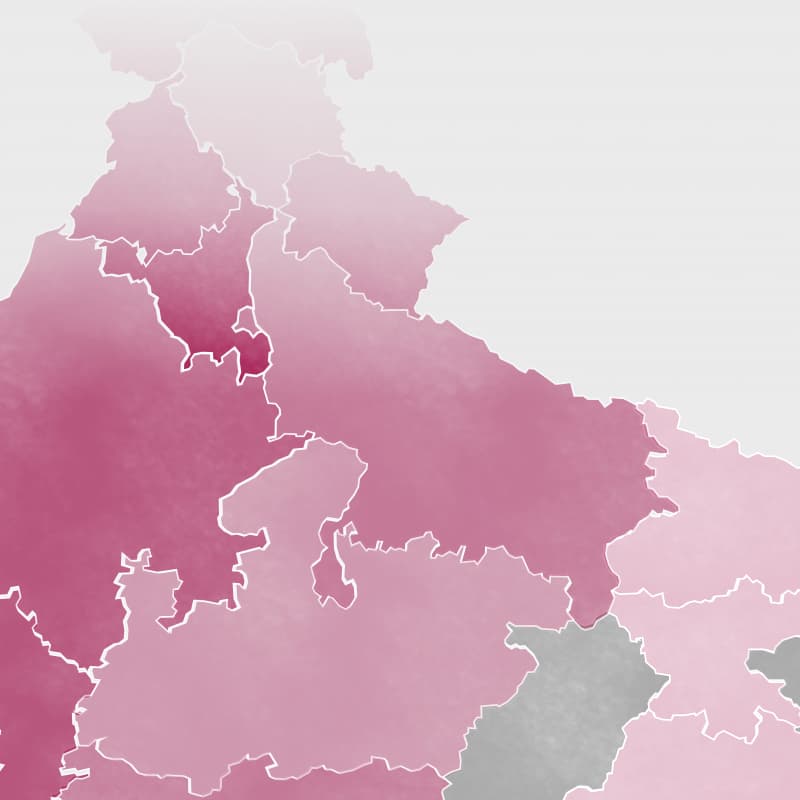
Unwanted
Investigative report about the missing girls of India.
View online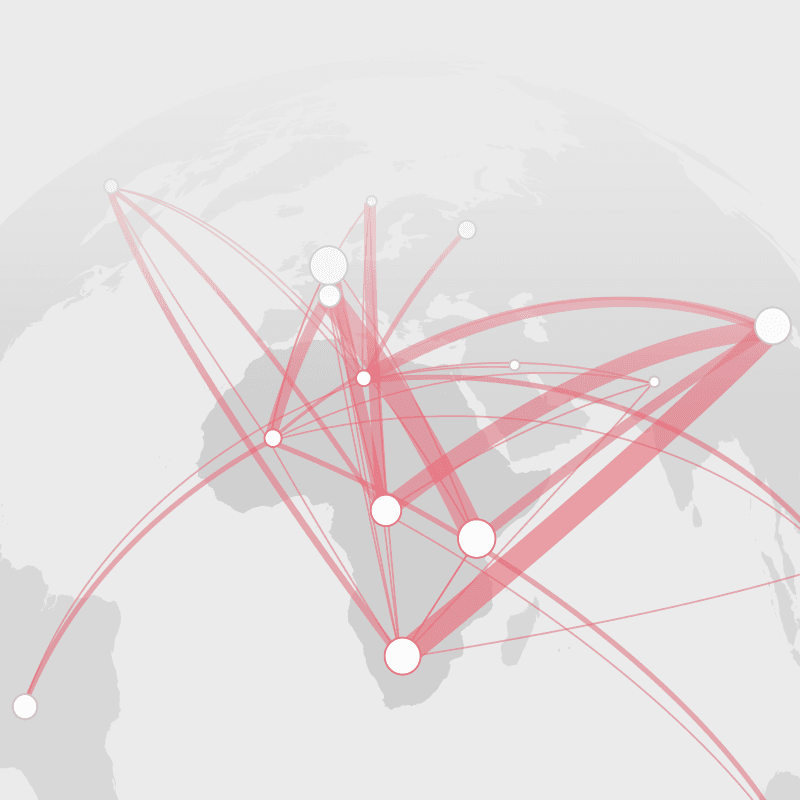
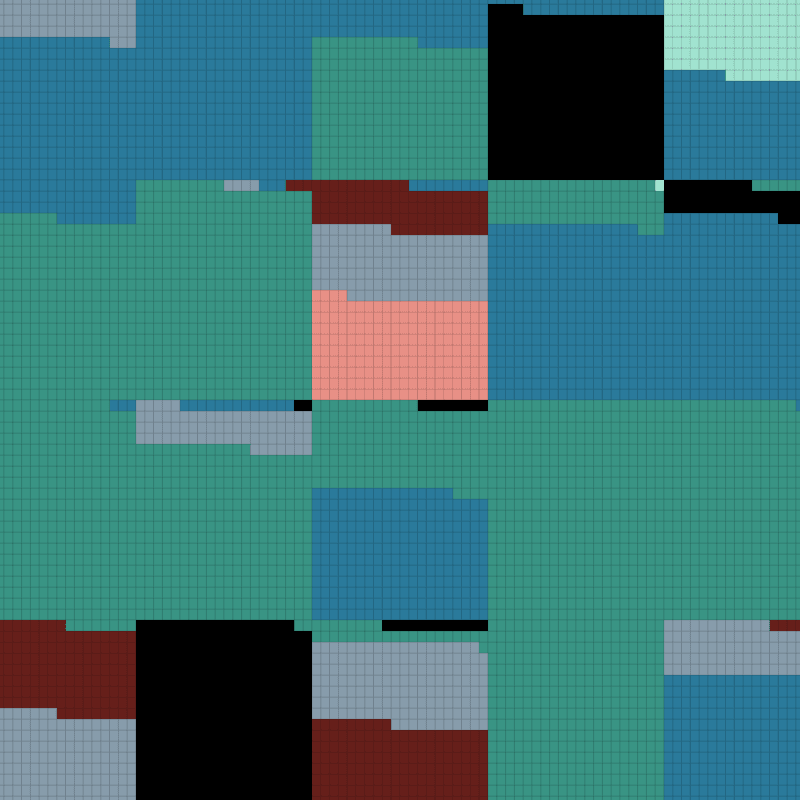
Global Trade Africa
Visualization of trade flows between African countries and the rest of the world.
View online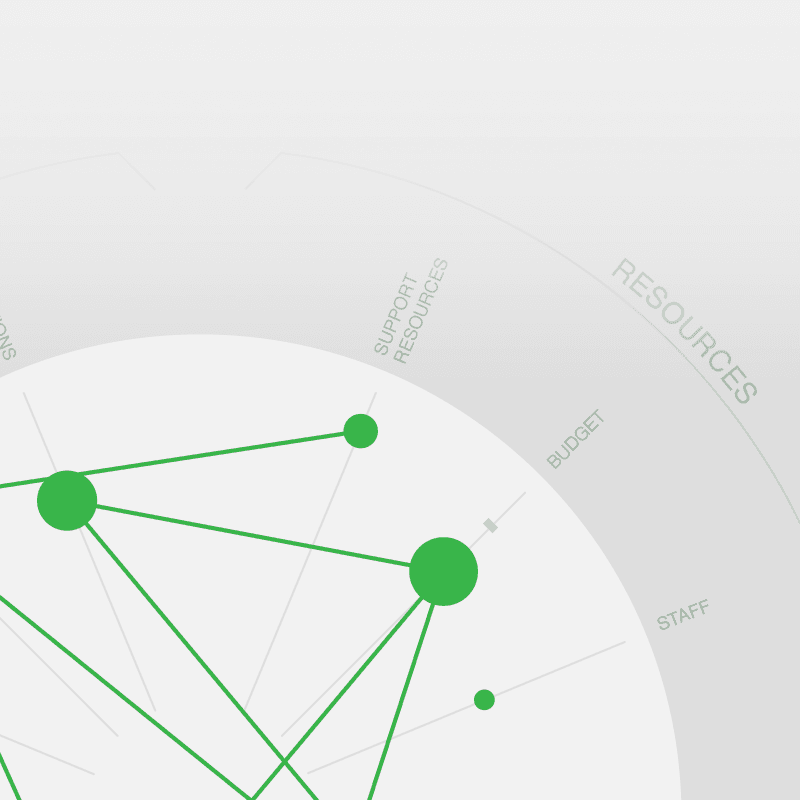
Confluence Diagram
Embedded knowledge and dependency visualization.
View online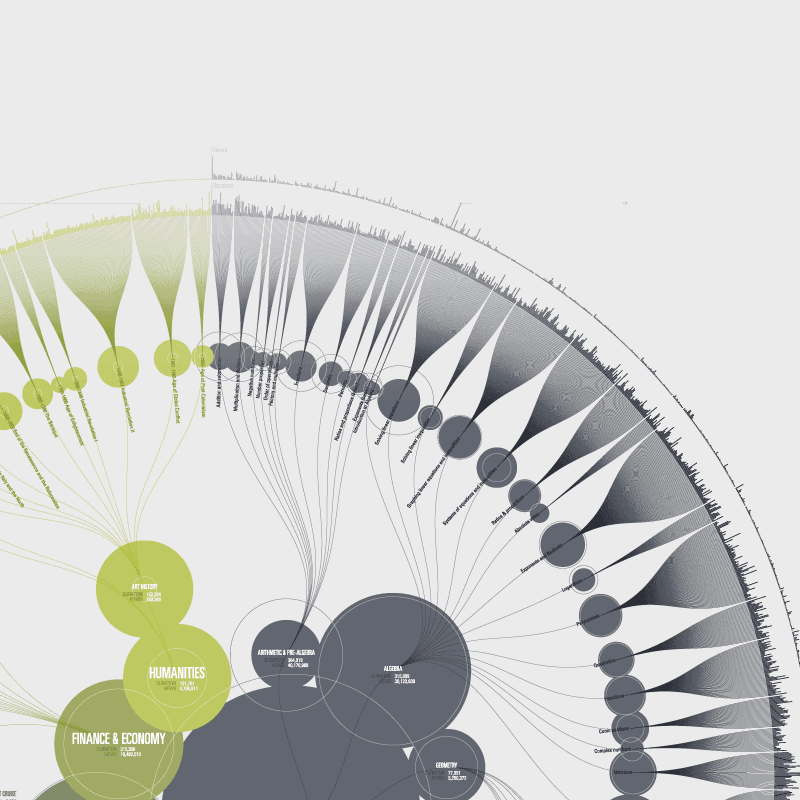
Khan Academy
Visualization of a library of learning resources.
View online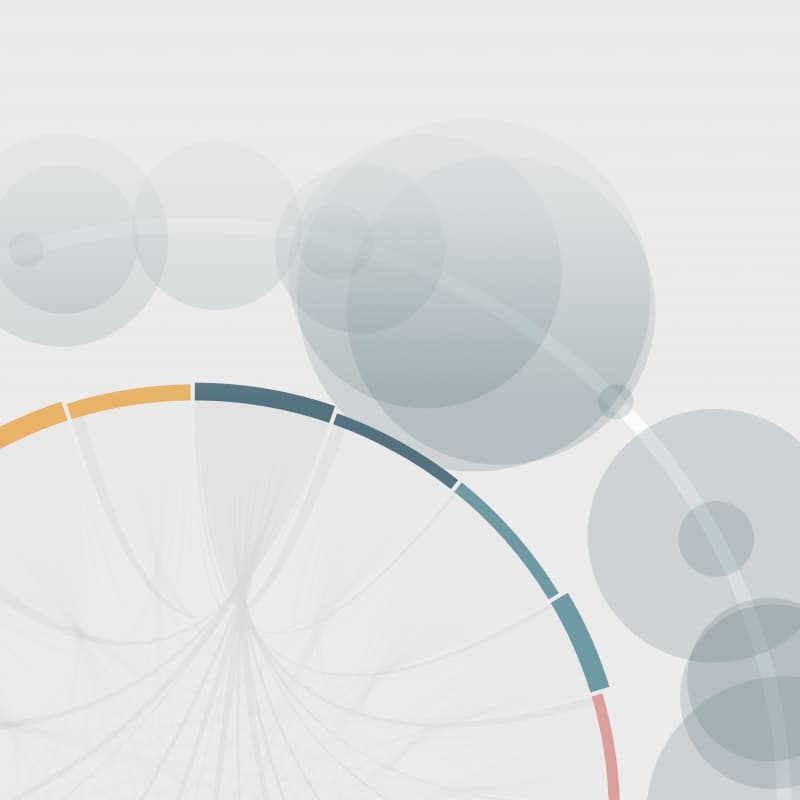
Visualizing Substratum
Analysis and visualization of text semantics and similarity.
View online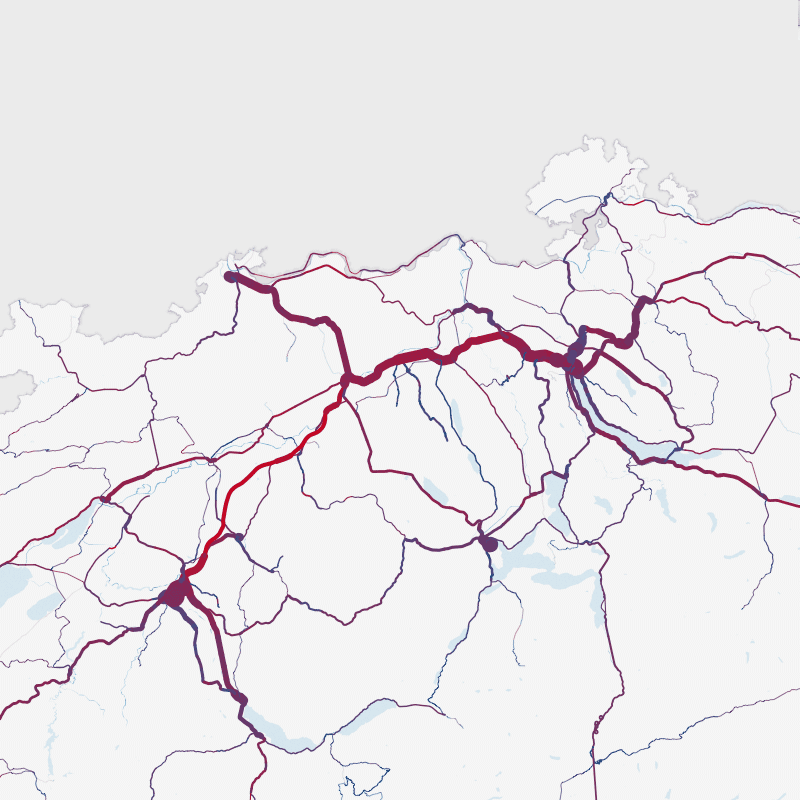
Make Open Data
Animated visualization of the Swiss railroad activity.
View online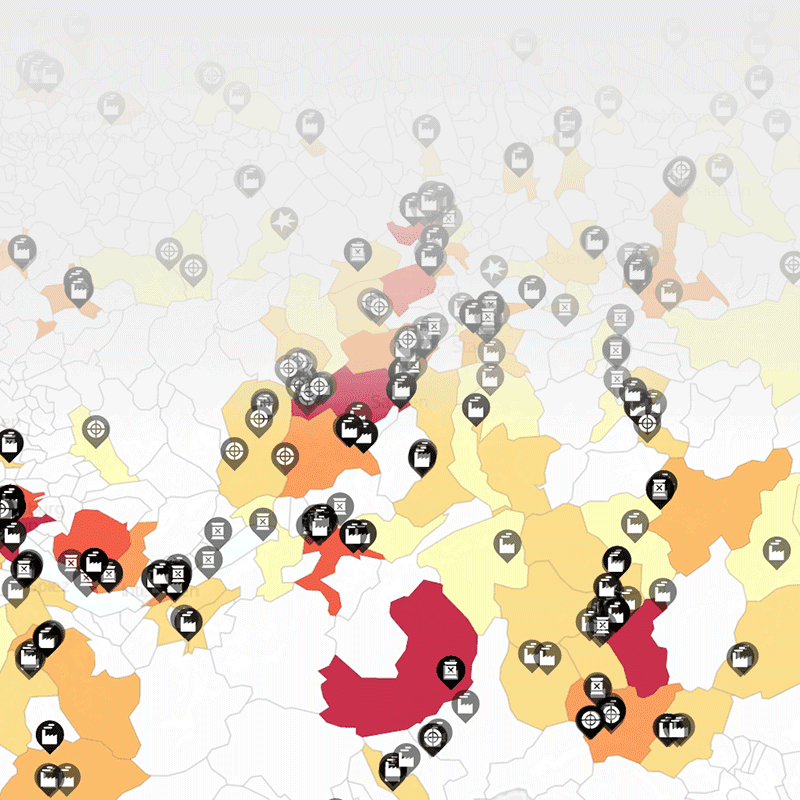
Make Open Data
Geographic visualization of contaminated sites in Switzerland.
View online
Retype
Multitouch Text Entry
View online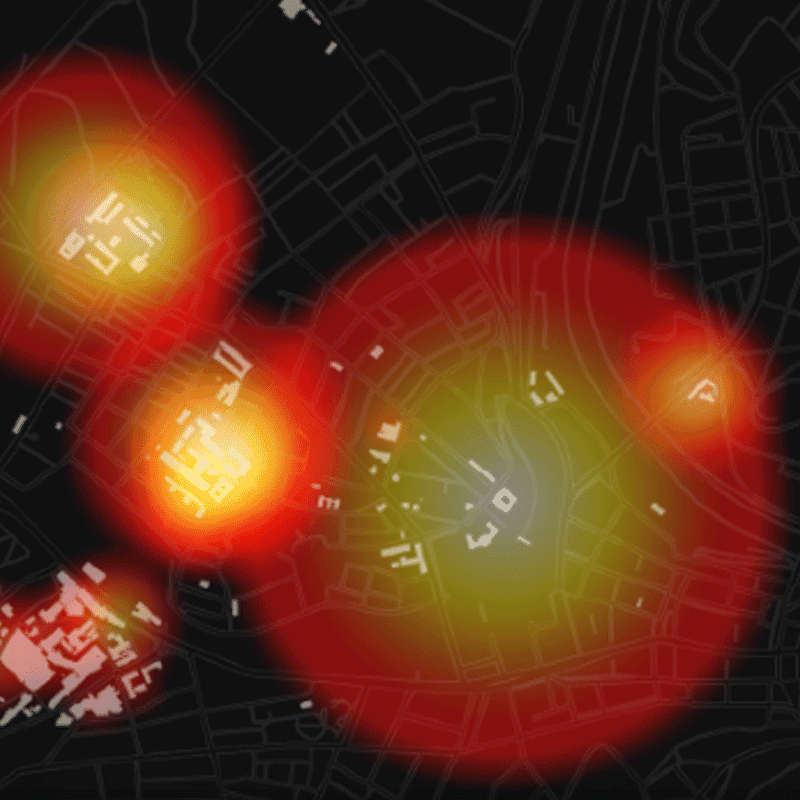
Candeo
Visual Risk Management
View onlineOpen Source
Catalog
A Javascript library for creating living style guides using Markdown or React.
View on GithubSwiss Maps
A Makefile to generate TopoJSON from Swisstopo geodata.
View on GithubGSheets
A Javascript library for retrieving Google Sheets as plain objects.
View on GithubArticles
Data Visualization for Exploration and ExplanationData Visualization in Social Science and Market Research, DGOF, 2021
Organizing the Work of Data-Driven Visual StorytellingData-Driven Storytelling, AK Peters, 2019
Feature & InterviewData Visualization for Success, Images Publishing Group, 2017
Dynagrams: Enhancing Design Thinking Through Dynamic DiagramsDesign Thinking for Innovation, Springer-Verlag, 2016
Prototyping und StorytellingDesign Thinking Das Handbuch, Frankfurter Allgemeine Buch, 2015
From Experience to UnderstandingNew Challenges For Data Design, Springer-Verlag, 2014
The Confluence Diagram: Embedding Knowledge in Interaction ConstraintsAccepted Poster InfoVis, 2014
InterviewVisualising Data, 2014
History of Datavisualization.chSwiss Analytics Magazine, 2013
InterviewPage Magazine, 2013
InterviewVisual News, 2010
Workshops
Data SketchingZürich, 2025
Design LeadershipZürich, 2021
Visualize Thick DataZürich, 2017
OKNF ConferenceGeneva, 2013
Fossgis ConferenceRapperswil, 2013
See+ WorkshopWiesbaden, 2013
Lift ConferenceGeneva, 2013
See+ WorkshopWiesbaden, 2012
Opendata.chBern, 2011
See+ WorkshopWiesbaden, 2011
Presentations
Data Visualization LectureLuzern, 2025
Envisioning Intelligences TalkOnline, 2025
Data Visualization LectureLuzern, 2025
On Data And Design TalkBasel, 2025
Data Visualization LectureLuzern, 2024
Data Visualization TalkLuzern, 2024
Data Visualization MeetupBern, 2024
Data Visualization ModuleLuzern, 2024
Data Visualization LectureLuzern, 2024
Data Visualization LectureBaden, 2024
Data Visualization LectureBaden, 2023
Data Visualization LectureLuzern, 2023
Interested in working with us?